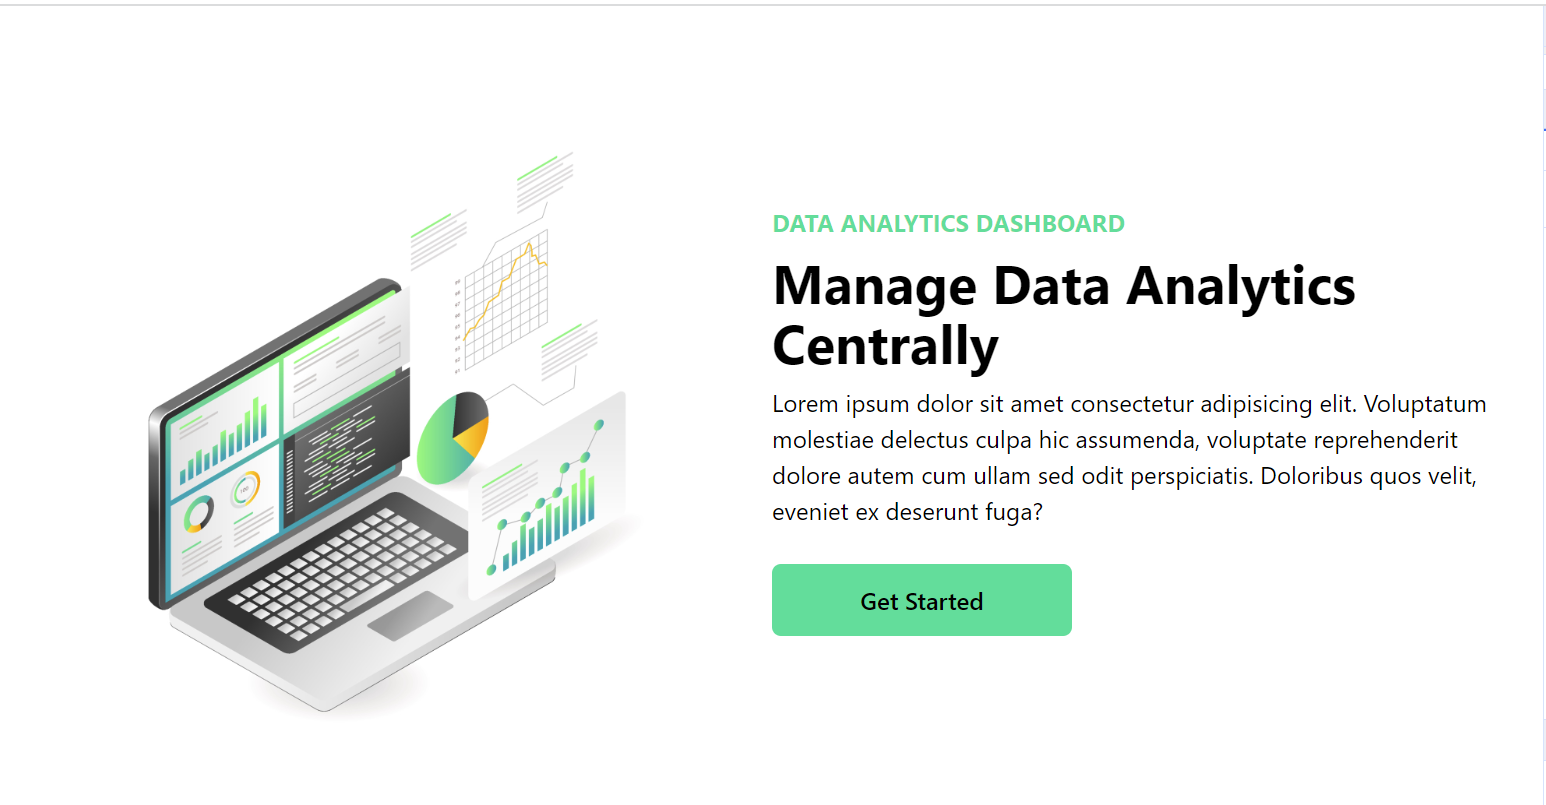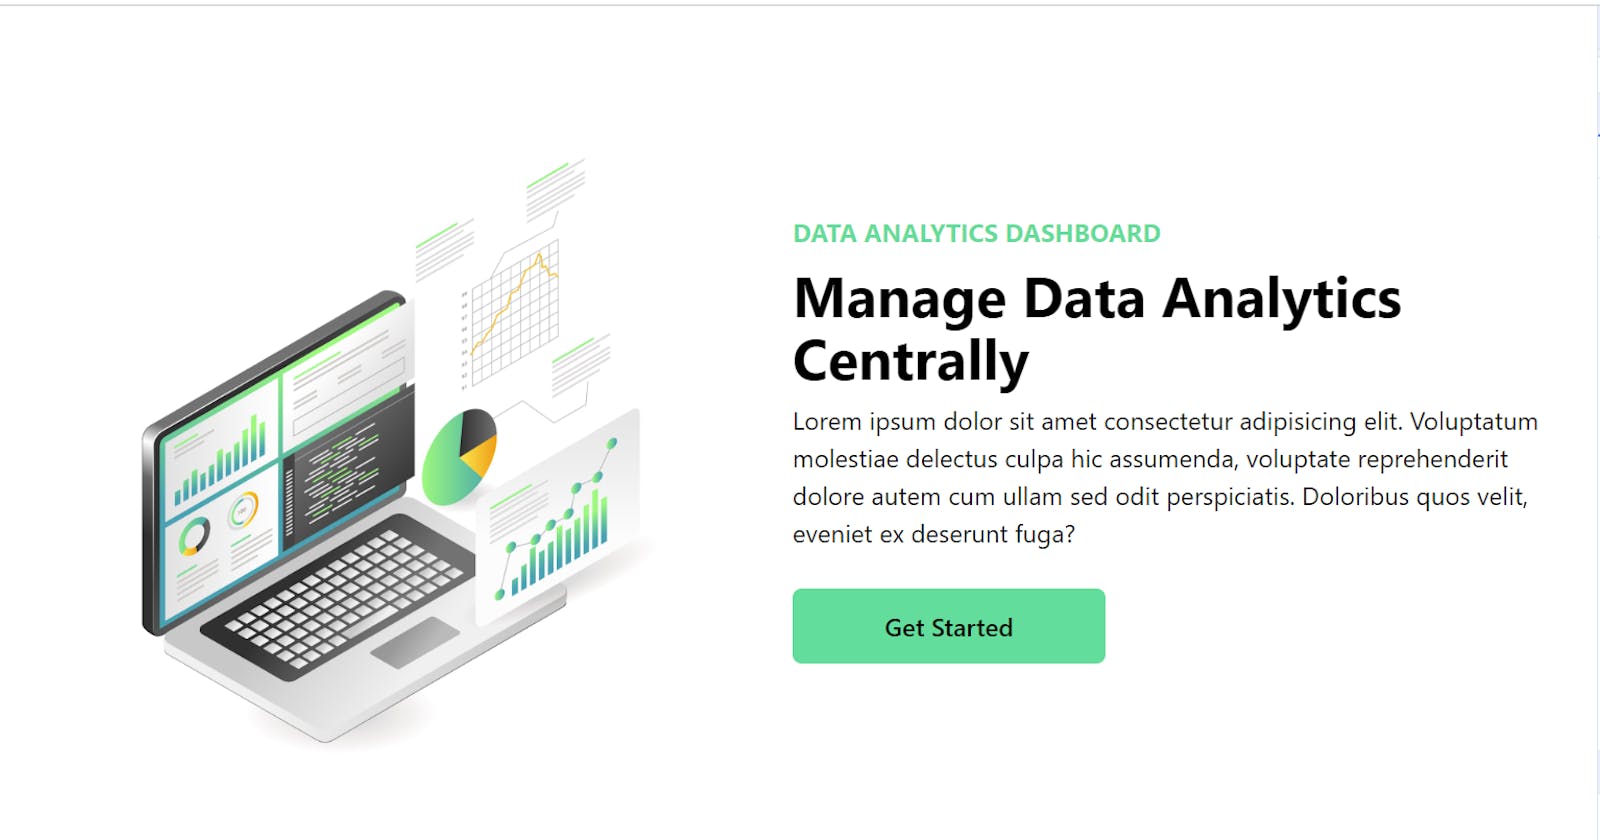
In the ever-evolving landscape of web development, creating powerful and visually appealing dashboards is a key aspect. Dashboards play a crucial role in presenting data in a comprehensible and user-friendly manner. In this article, we’ll explore a simple yet elegant React codebase for a Data Analytics Dashboard.
The App Structure
Let’s begin by examining the main entry point of our React application, the App.js file:
// app.js
import React from "react";
import Analytics from "./components/Analytics";
function App() {
  return (
    <div>
      <Analytics />
    </div>
  );
}
export default App;
Here, we have a basic React functional component named App that renders an Analytics component. Now, let's delve into the Analytics component.
The Analytics Component
The Analytics.js file contains the code for our Data Analytics Dashboard:
// analytics.js
import React from "react";
const Analytics = () => {
  return (
    <div className="w-full bg-white py-16 px-4">
      <div className="max-w-[1240px] mx-auto grid md:grid-cols-2">
        {/* Image Section */}
        <img
          className="w-[500px] mx-auto my-4"
          src={"https://i.imgur.com/tz4Vkxh.jpg"}
          alt="/"
        />
        {/* Text and Button Section */}
        <div className="flex flex-col justify-center">
          <p className="text-[#00df9a] font-bold ">DATA ANALYTICS DASHBOARD</p>
          <h1 className="md:text-4xl sm:text-3xl text-2xl font-bold py-2">
            Manage Data Analytics Centrally
          </h1>
          <p>
            Lorem ipsum dolor sit amet consectetur adipisicing elit. Voluptatum
            molestiae delectus culpa hic assumenda, voluptate reprehenderit
            dolore autem cum ullam sed odit perspiciatis. Doloribus quos velit,
            eveniet ex deserunt fuga?
          </p>
          <button className="bg-black text-[#00df9a] hover:text-black hover:bg-[#00df9a] duration-75 w-[200px] rounded-md font-medium my-6 mx-auto md:mx-0 py-3">
            Get Started
          </button>
        </div>
      </div>
    </div>
  );
};
export default Analytics;
In this component, we have divided our dashboard into two main sections: an image section and a text/button section. The styling is achieved using Tailwind CSS classes, providing a responsive and visually appealing layout.
Conclusion
Building a Data Analytics Dashboard with React is made simpler and more modular with components. This codebase serves as a foundation that can be extended and customized based on specific requirements. Whether you are a seasoned developer or just starting with React, this example provides insights into creating dynamic and engaging dashboards.
Feel free to experiment with additional features, integrate data visualization libraries, or enhance the styling further. The world of web development is vast, and creating powerful dashboards is a valuable skill that opens up endless possibilities for data presentation and analysis. Happy coding!
